
In the dynamic world of real estate, change is the only constant. The pandemic sent the market into overdrive, but higher mortgage rates had slowed the pace—until now. The number of homes for sale has surged, reaching the highest levels since 2019, even in the pandemic ‘boomtowns.’
Market Surge: Key Insights
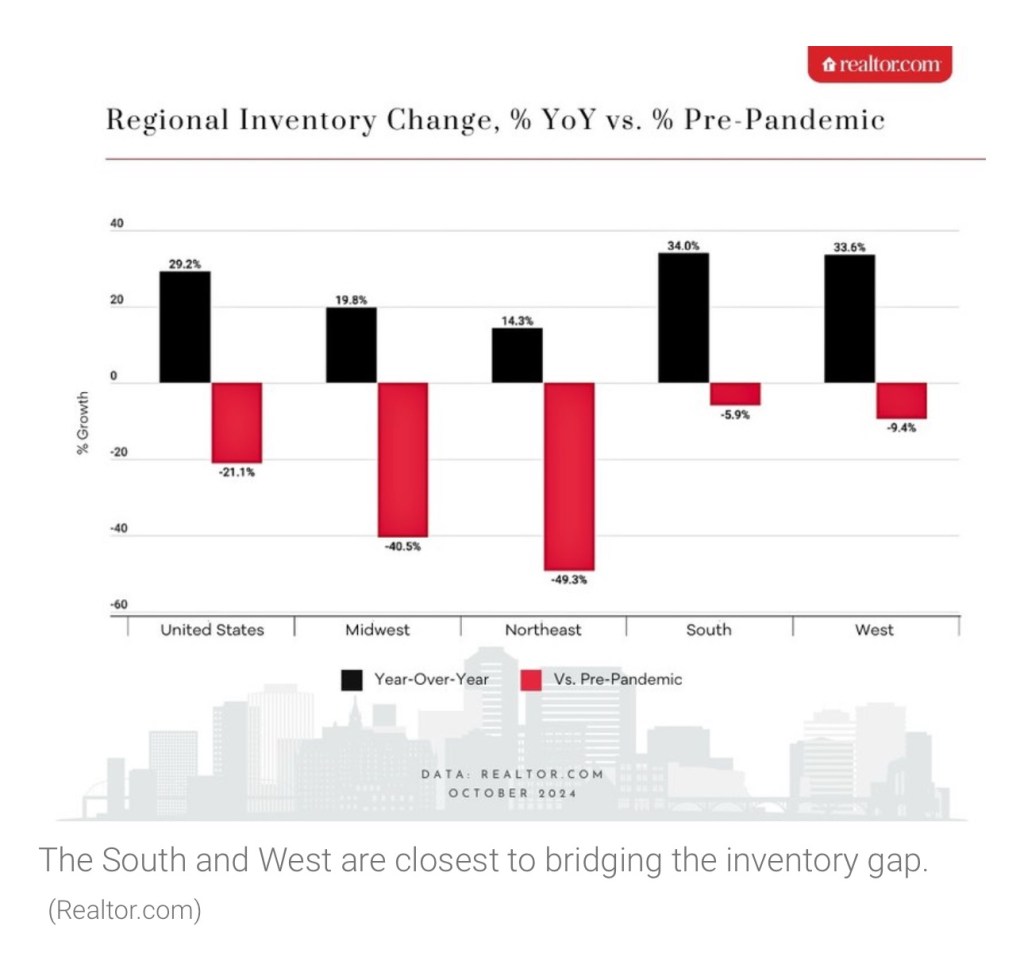
According to Realtor.com®’s senior economist Ralph McLaughlin, the total number of homes for sale in October increased by 29.2% compared to the previous year. This marks the 12th consecutive month of growth. Sellers have stepped up their activity, with active listings reaching levels not seen since before the pandemic. The sharp decrease in mortgage rates in mid-August likely contributed to this surge, enticing homeowners to sell.
Pandemic ‘Boomtowns’ Lead the Way
Active home listings are up across all four U.S. regions. The South leads with a staggering 34% increase, followed by the West at 33.6%, the Midwest at 19.8%, and the Northeast with a 14.3% uptick. Pandemic boomtowns such as Austin, TX, Memphis, TN, and Orlando, FL, are witnessing significant inventory growth, surpassing pre-pandemic levels.
Notably, metros like San Diego, CA, Seattle, WA, and Denver, CO, have seen the largest increases in the number of homes for sale, with jumps of 63.5%, 60.5%, and 59.5%, respectively.
Fresh Listings on the Rise
The increase in housing stock is not just from lingering listings. Newly listed homes rose by 4.9% over last year’s levels, showing a robust spike in seller activity. Buyers searching for fresh listings will find the most success in the West, with a 7% increase, followed by the Midwest at 5.1%, the Northeast at 3.2%, and the South at 2.9%.
What’s Ahead for the Market?
November and December are typically slower months in the housing market. However, McLaughlin suggests that listing activity might increase post-election, driven by falling mortgage rates and a low benchmark from 2023.
Home Prices Steady but Square Footage Costs Rise
While the median home price remains steady at $424,950, the median price per square foot continues to climb, increasing by 2.1% in October compared to the previous year. Since October 2019, the price per square foot has surged by an astounding 50.5%. Major metros like New York, Hartford, and Boston have seen significant increases in price per square foot over the past five years.
Affordability and Time on Market
Despite a stable median home price, 18.6% of listings saw price cuts in October, consistent with the previous year. Homes are taking longer to sell, with the typical home spending 58 days on the market in October, eight days longer than the same period last year. This extended timeframe offers buyers more time to make decisions but also indicates an increase in competition as new listings come to market.
Parting Thoughts
For real estate developers and investors, these trends highlight a transforming market landscape. The rise in active listings, especially in pandemic boomtowns, coupled with steady home prices and increasing price per square foot, presents both challenges and opportunities. As we move into the year-end, staying informed and adaptable will be crucial in navigating this dynamic market.
Join the Conversation: What are your thoughts on the surge in housing inventory and its impact on the market? How do you plan to navigate these trends in your investments? Share your insights and engage with our community!
What are your views on the current housing market trends? Let’s discuss below! 💬🏡


Leave a comment